Specifier Protocol • Field Reliability & Serviceability
A multi-site, crossover, field-ready protocol designed to quantify false-trigger resistance, uptime, and service burden in difficult real-world restrooms with reflective basins, bright light, and pass-by traffic conditions.
Disclosure: This is intended for a specifier protocol completed and published by Fontana.
1) Objective
To quantify whether Fontana Touchless delivers reliable, low-nuisance operation in real-world commercial restrooms with challenging conditions (reflective basins, bright lighting/daylight, and pass-by traffic), and whether it maintains high uptime with a low service burden.

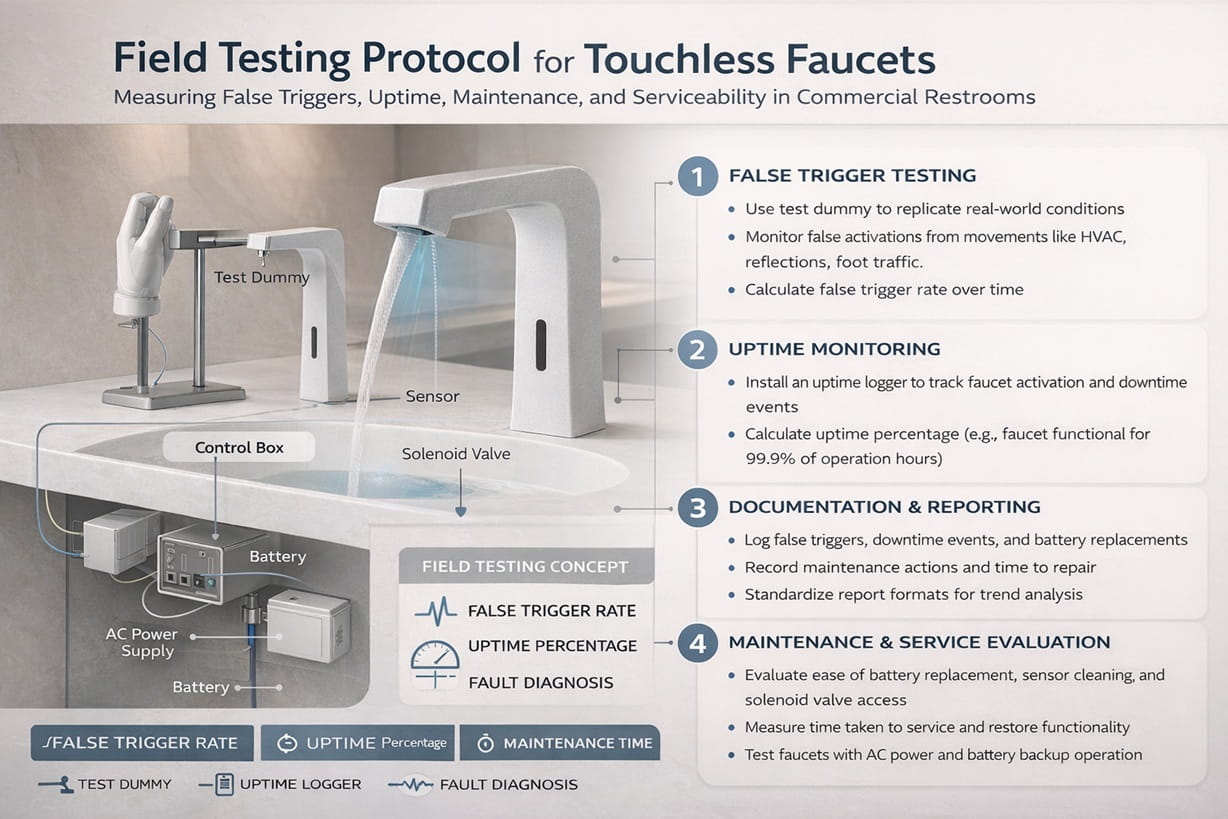
2) Primary endpoints — what “reliability” means here
- Unintended activations per day (false triggers): activations without an intentional hand-wash event.
- False-trigger rate: unintended activations ÷ total activations.
- Uptime: % of time faucet is functional and in-service.
- Service events: number of maintenance interventions per 1,000 activations.
3) Secondary endpoints (operational and sustainability outcomes)
- Water use per “handwash event” (liters or gallons per event).
- Run-on time: average seconds of flow after hands leave the sensing zone.
- Mean time to repair (MTTR): minutes from service start to restoration.
- Vandal/tamper incidents: number and severity; time to restore service.
4) Study design (best-practice, credible, and fair)
Design: Multi-site, controlled, crossover field study.
- Sites: 6 facilities across varied environments (airport/transport hub, stadium/arena, large office, university, hospital outpatient, retail/mall).
- Restroom bays: 8 sink stations per site (48 total stations).
- Phases:
- Baseline phase (4 weeks): a touchless brand or configuration that already exists.
- Fontana phase (4 weeks): The Fontana Touchless was put in and set up to work with the same basin shape.
- Standardization: same target flow rate and aerator class in all phases to separate sensor reliability from flow differences.
5) Instrumentation (how to measure results without bias)
- Event logging: inline flow meter + valve open/close timestamps for activation count and run time.
- Context tagging: occupancy sensor or people counter to identify pass-by traffic windows and local crowding.
- Audit sampling: randomized two-hour video blocks using privacy-protecting angles and blur for classification accuracy.
- Service log: standardized ticketing (cause category, parts used, repair start/finish times, and restore confirmation).
6) Clear definitions (so “false trigger” is defensible)
- Intended handwash event: hand enters detection zone and remains ≥ 0.6 seconds in basin-facing posture.
- Unintended activation: valve opens with no hands within zone, or opens during pass-by without basin-facing posture.
- Run-on: seconds between last valid “hands present” moment and valve close.
7) Analysis plan
Results are reported per station and aggregated by site, with confidence intervals. A credible “leadership-grade” result typically includes improvements across nuisance activation, uptime, and service burden simultaneously.
| Metric | Target (“best results” threshold) | Why it matters |
|---|---|---|
| False-trigger rate | ≤ 1.0% of total activations | placeholderKeeps nuisance activations negligible even under heavy traffic and bright ambient light. |
| Unintended activations | ≤ 2 per station per day (high-traffic sites) | placeholderFits with “low complaint” operation and cuts down on wasted water and bad publicity. |
| Uptime | ≥ 99.5% | placeholderMinimizes closed fixtures, user disruption, and facility staff call-backs during peak hours. |
| Service events | ≤ 0.5 per 1,000 activations | placeholderThis means that operations are easy to predict and don’t require much maintenance across many sites. |
| MTTR | ≤ 15 minutes median | placeholderDemonstrates serviceability, rapid recovery, and reduced downtime exposure for public facilities. |
| Run-on time | ≤ 0.8 seconds median | placeholderPrevents waste after hands leave zone and supports measurable indoor water reduction goals. |
8) Reporting
- Site descriptions (basin reflectance, lighting, traffic patterns, sink line spacing).
- Details about the configuration, such as the range settings, sensor mode, flow rate/aerator, and power type.
- Main results with confidence intervals and summaries for each site.
- Comparison plots for before and after: unintended activations per day, uptime, and MTTR.
- Limitations and assumptions (video sampling rate, changes in daylight throughout the year, and differences between sites).

FontanaShowers Studies (Touchless Faucets / Touchless Technology)
External References (Organizations, EPA, Universities, and Other Brands)
Government / EPA / Federal Programs
Green Building / Standards & Rating Systems (LEED / USGBC)
Universities / Research & Academic-Adjacent Reports
Other Brands / Manufacturer Technical Docs

Independent Studies & Research on Touchless / Sensor-Operated Faucets (More Links)
Independent Studies & Research (Bibliography) — Touchless / Sensor-Operated Faucets
Why This Kind of Field Protocol Matters
Specifier decisions are often based on product sheets, flow rates, and finish options, but long-term performance in busy restrooms depends on much more than that. Real-world conditions such as mirrored basins, side traffic, strong daylight, and inconsistent user behavior can expose weaknesses that do not appear during simple bench testing. That is why a structured field protocol adds practical value for architects, facility teams, and project owners.
A study design focused on false triggers, uptime, and service events helps move the conversation from marketing claims to measurable outcomes. It also makes it easier to compare products fairly across airports, offices, hospitals, and retail buildings where usage patterns differ. For specifiers, this kind of evidence supports better decisions around maintenance planning, water efficiency, and total cost of ownership.
In practice, the strongest touchless faucet systems are not only the ones that activate quickly. They are the ones that stay reliable under pressure, recover fast after service, and continue working with minimal nuisance activations over time. A protocol like this gives buyers a clearer framework for judging whether a touchless faucet is truly ready for demanding commercial use.